What is insurance costing your business?
See its impact on your profitability and explore what potential savings could mean.
Free. No account or quote request required.
Start with three numbers
Use totals from the same 12-month period, in U.S. dollars.
Your figures stay in this page. They are not saved or sent to InsurMyBiz or an agent. Refreshing clears them.
Your insurance cost breakdown
Example figures — replace them with your own for a personal breakdown.
- Annual insurance expense
- Share of revenue
- Compared with annual profit
No revenue reported for this period.
Compared with last year
Revenue
Insurance expense
What could a reduction mean?
Choose a hypothetical saving to see the financial impact.
- Lower annual expense
Illustrative scenario, not an estimate or promise of available savings. Assumes revenue and other expenses stay the same; income tax effects are excluded.
What these numbers tell you
This shows the financial impact of insurance costs. It does not establish whether you are overpaying or have the right coverage. A lower premium can come with different limits, deductibles, or exclusions; an agent can explain those differences.
Take a closer look at your business finances.
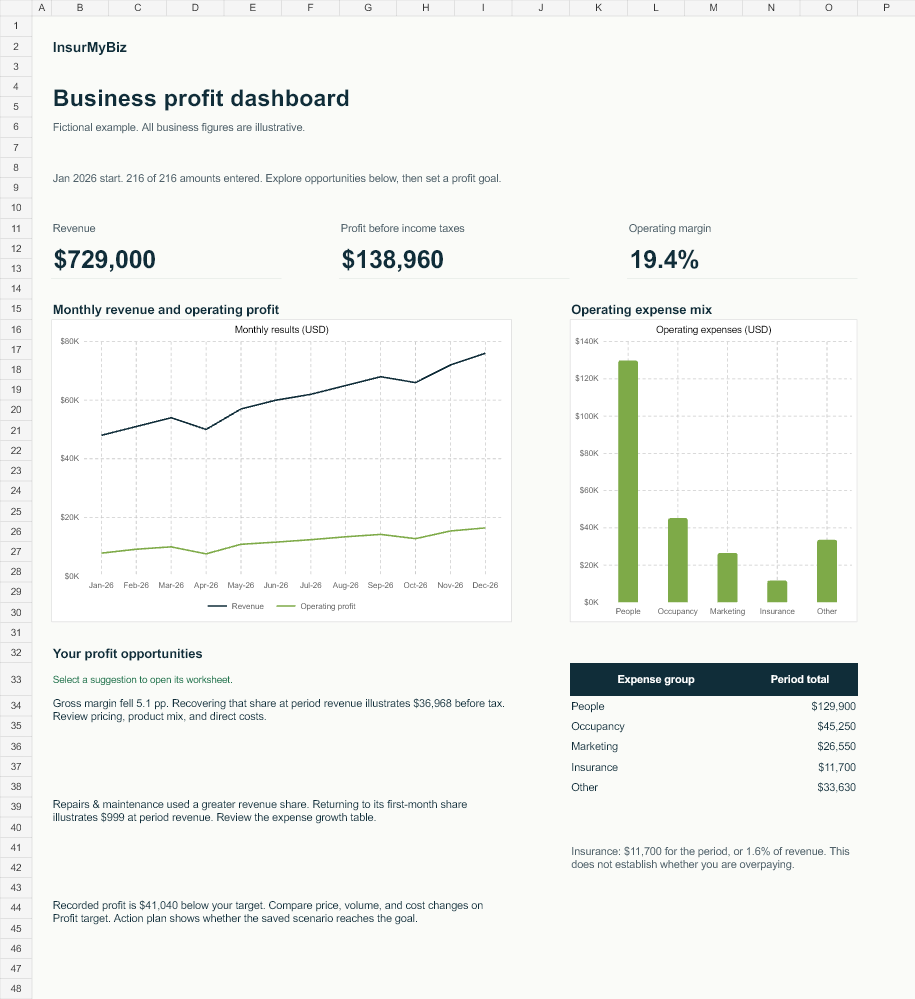
Our free Excel workbook brings your monthly figures into one clear view. See where your money goes and explore ways to improve profitability.
- A profit dashboard with opportunities expressed in dollars
- A guided start with one month of figures and a profit goal
- A what-if planner and printable action plan with owners and due dates
- A three-month cash planner for collections, payments, and reserves
No signup, macros, or financial uploads. Use it offline in Excel. The example uses fictional figures; scenarios are illustrative.